How to debug your SharePoint Framework unit-tests
This post is over a year old, some of this information may be out of date.
The reason you probably read this post is that you already wrote some unit tests for SharePoint Framework projects and you stumble upon a problem and want to debug one of your unit-tests.
Apparently, the process is not so easy as linking your debugger to the gulp test task. There is a bit more plumbing involved to get a good experience. In this article, I explain a couple of ways to start debugging your unit-tests.
Info: For this article, I assume that you already written some unit-tests. As I will not be explaining how to write them. For more information about writing unit-tests, you can read the following article: Writing unit tests for your SharePoint Framework components.
The quick way
First of all, the quick way to debug your unit-tests is by running the following command: gulp test --debug. This would start the test process with an open debugging session and allows you to run your tests in your browser.
Is it that easy? More or less. I indeed said that there was some more plumbing involved, and you will immediately see what I mean by that.
When you run the command, the test task will start, but from the moment it starts up the Karma process it will wait.
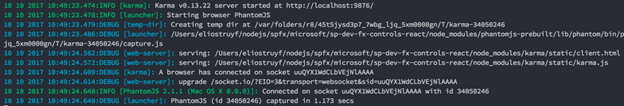
The reason it waits is to allow you to connect to the test process via the following URL: http://localhost:9876. When you open your browser to that location, you see the following page:
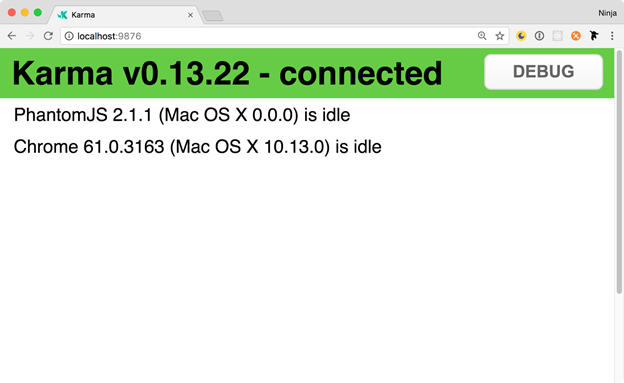
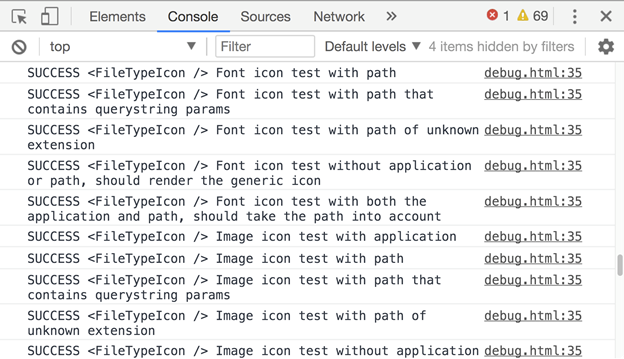
By clicking on the debug button (or by directly loading the following page: http://localhost:9876/debug.html), you can start your debugging session in Chrome. Check the console for the test output.
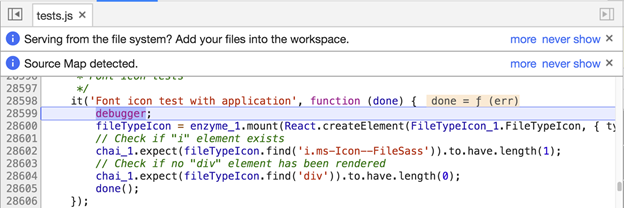
Tip: Probably the easiest way to start is by using the debugger statement in your tests. That way you do not have to look through the code to set your breakpoints.
Debugging unit-tests in Visual Studio Code
Now that you know how to start a debugging session, it is time to show you how to do the debugging in Visual Studio Code.
Adding the following configuration to your launch.json file in Visual Studio Code will allow you to debug your unit tests in VSCode instead of Chrome.
{ "name": "Debug unit test (simple)", "type": "chrome", "request": "launch", "url": "http://localhost:9876/debug.html"}You start your debugging session again by running: gulp test --debug. Once started, you can press F5 to start the VSCode debugging session.
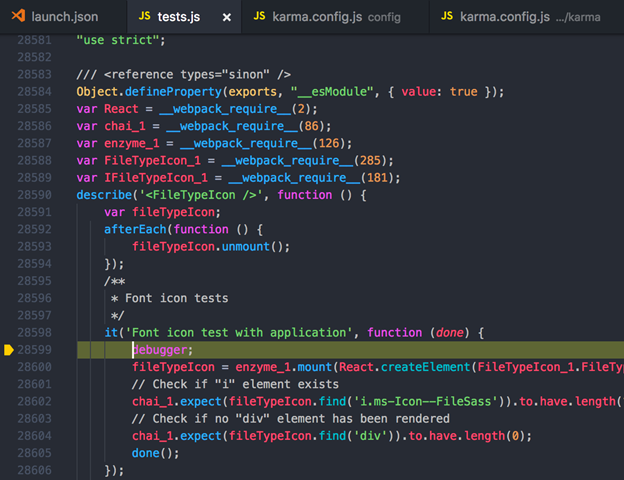
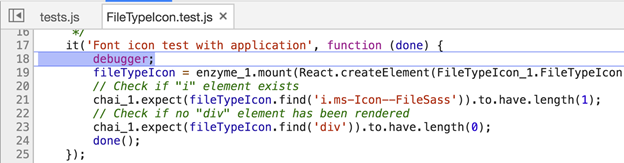
This was not that, hard, right? This is indeed the quick way to debug your unit-tests. The next step will be to extend the unit-test process to get a better experience. The reason why is if you take a good look at the above two screenshots, you will see a tests.js file which is being loaded. This file is a bundle of all your tests created by Webpack. Depending on the number of files and code, you might experience that this process of debugging is very slow. A better way is to debug the individual unit-test files, but it requires a couple of things.
Extending the test runner in order to get a better debugging experience
Info: The things you need to do in order to extend your test runner, are explained in the following article: Extend Karma to get better code coverage and test reports for your SharePoint Framework solutions.
If you followed the article mentioned above, you should now have a custom karma.config.js file in your project and a Karma config binding in the gulpfile.js file.
Config binding:
const karmaTask = build.karma;if (karmaTask) { karmaTask.taskConfig.configPath = './config/karma.config.js';}The reason why we want to add a custom Karma config to add source maps into the generated tests.js bundle. In order to get this, add the following code to your karma.config.js file:
"use strict";const existingKarmaConfig = require('@microsoft/sp-build-web/lib/karma/karma.config');const sourcemap = require('karma-sourcemap-loader');
module.exports = function (config) { existingKarmaConfig(config);
// Check if in debug mode const debug = process.argv.indexOf('--debug') !== -1; if (debug) { /* Adding sourcemaps to the tests */ config.plugins.push(sourcemap); for (let key in config.preprocessors) { config.preprocessors[key].push('sourcemap'); } config.webpack["devtool"] = 'inline-source-map'; console.log(config); }};One more thing, in order to run the test task, you will have to install the karma-sourcemap-loader module to your project. You can do this by running: npm install karma-sourcemap-loader --save-dev --save-exact.
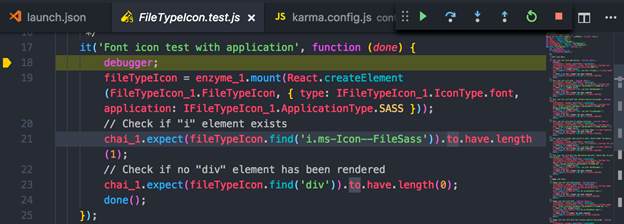
Right now, when you run the unit tests again with the debug flag, you should see the following outcome in the Chrome developer tools:
Note that you are not debugging in the tests.js file anymore.
The last step is to add a new configuration to the launch.json file in order to debug the test in VSCode.
{ "name": "Debug unit test (advanced)", "type": "chrome", "request": "launch", "url": "http://localhost:9876/debug.html", "webRoot": "${workspaceRoot}", "sourceMaps": true}Once this configuration has been added, run the gulp test command and press F5.
Info: At the moment, I only got it working with the JS source maps, if you now or find a way for getting the TypeScript files, feel free to let me know.
Sample
The unit-test SPFx sample that I created has been updated with the configuration of this article. You can check out the sample here: https://github.com/estruyf/spfx-testing-wp
Related articles
Writing unit tests for your SharePoint Framework components
SharePoint Framework code coverage reports for unit-tests
Extend Karma to get better code coverage and test reports for your SharePoint Framework solutions
Report issues or make changes on GitHub
Found a typo or issue in this article? Visit the GitHub repository to make changes or submit a bug report.
Comments

Let's build together
Manage content in VS Code
Present from VS Code
Engage with your audience throughout the event lifecycle