#DevHack: Getting some clarity in your site analytics
This post is over a year old, some of this information may be out of date.
This weekend I discovered a cool new tool from Microsoft called Clarity. The tool allows you to understand how users interact with your website. It can do this by using Google Analytics integration and features like session replays and heatmaps.
{{< blockquote type="info" text="https://clarity.microsoft.com/
I was not looking for such a tool. I just bumped into it. As I run a online sticker store these days, I thought to give it a try.
Setting up Clarity
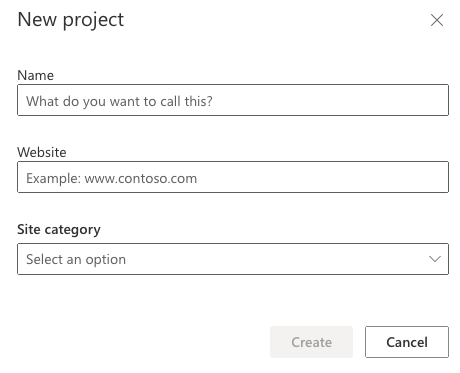
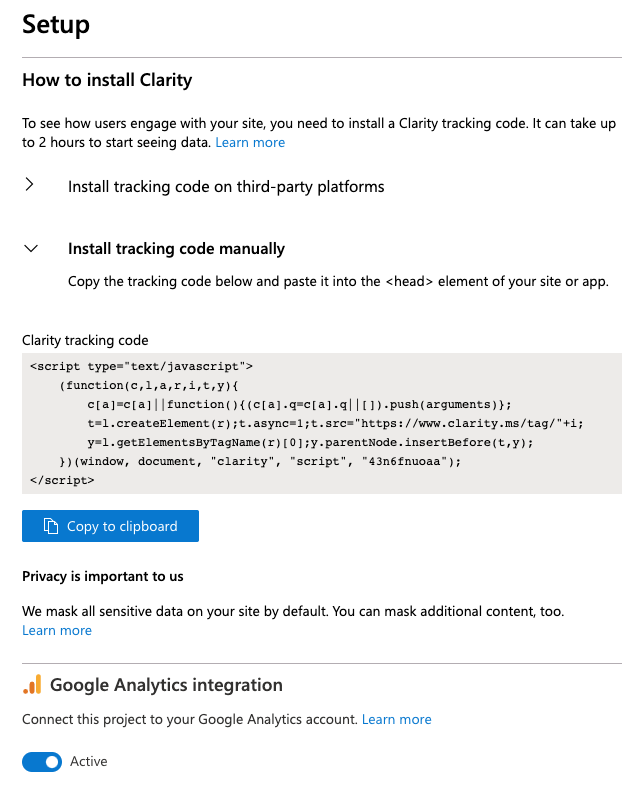
The setup is pretty easy once you logged in. The process is very similar to that of adding Google Analytics to your website. You start by creating a new project and adding the tracking code to your website.
On the setup page, you will also find Google Analytics Integration.
Get some clarity
Clarity is now only running for a day or two, but the project dashboard adds most of the value.
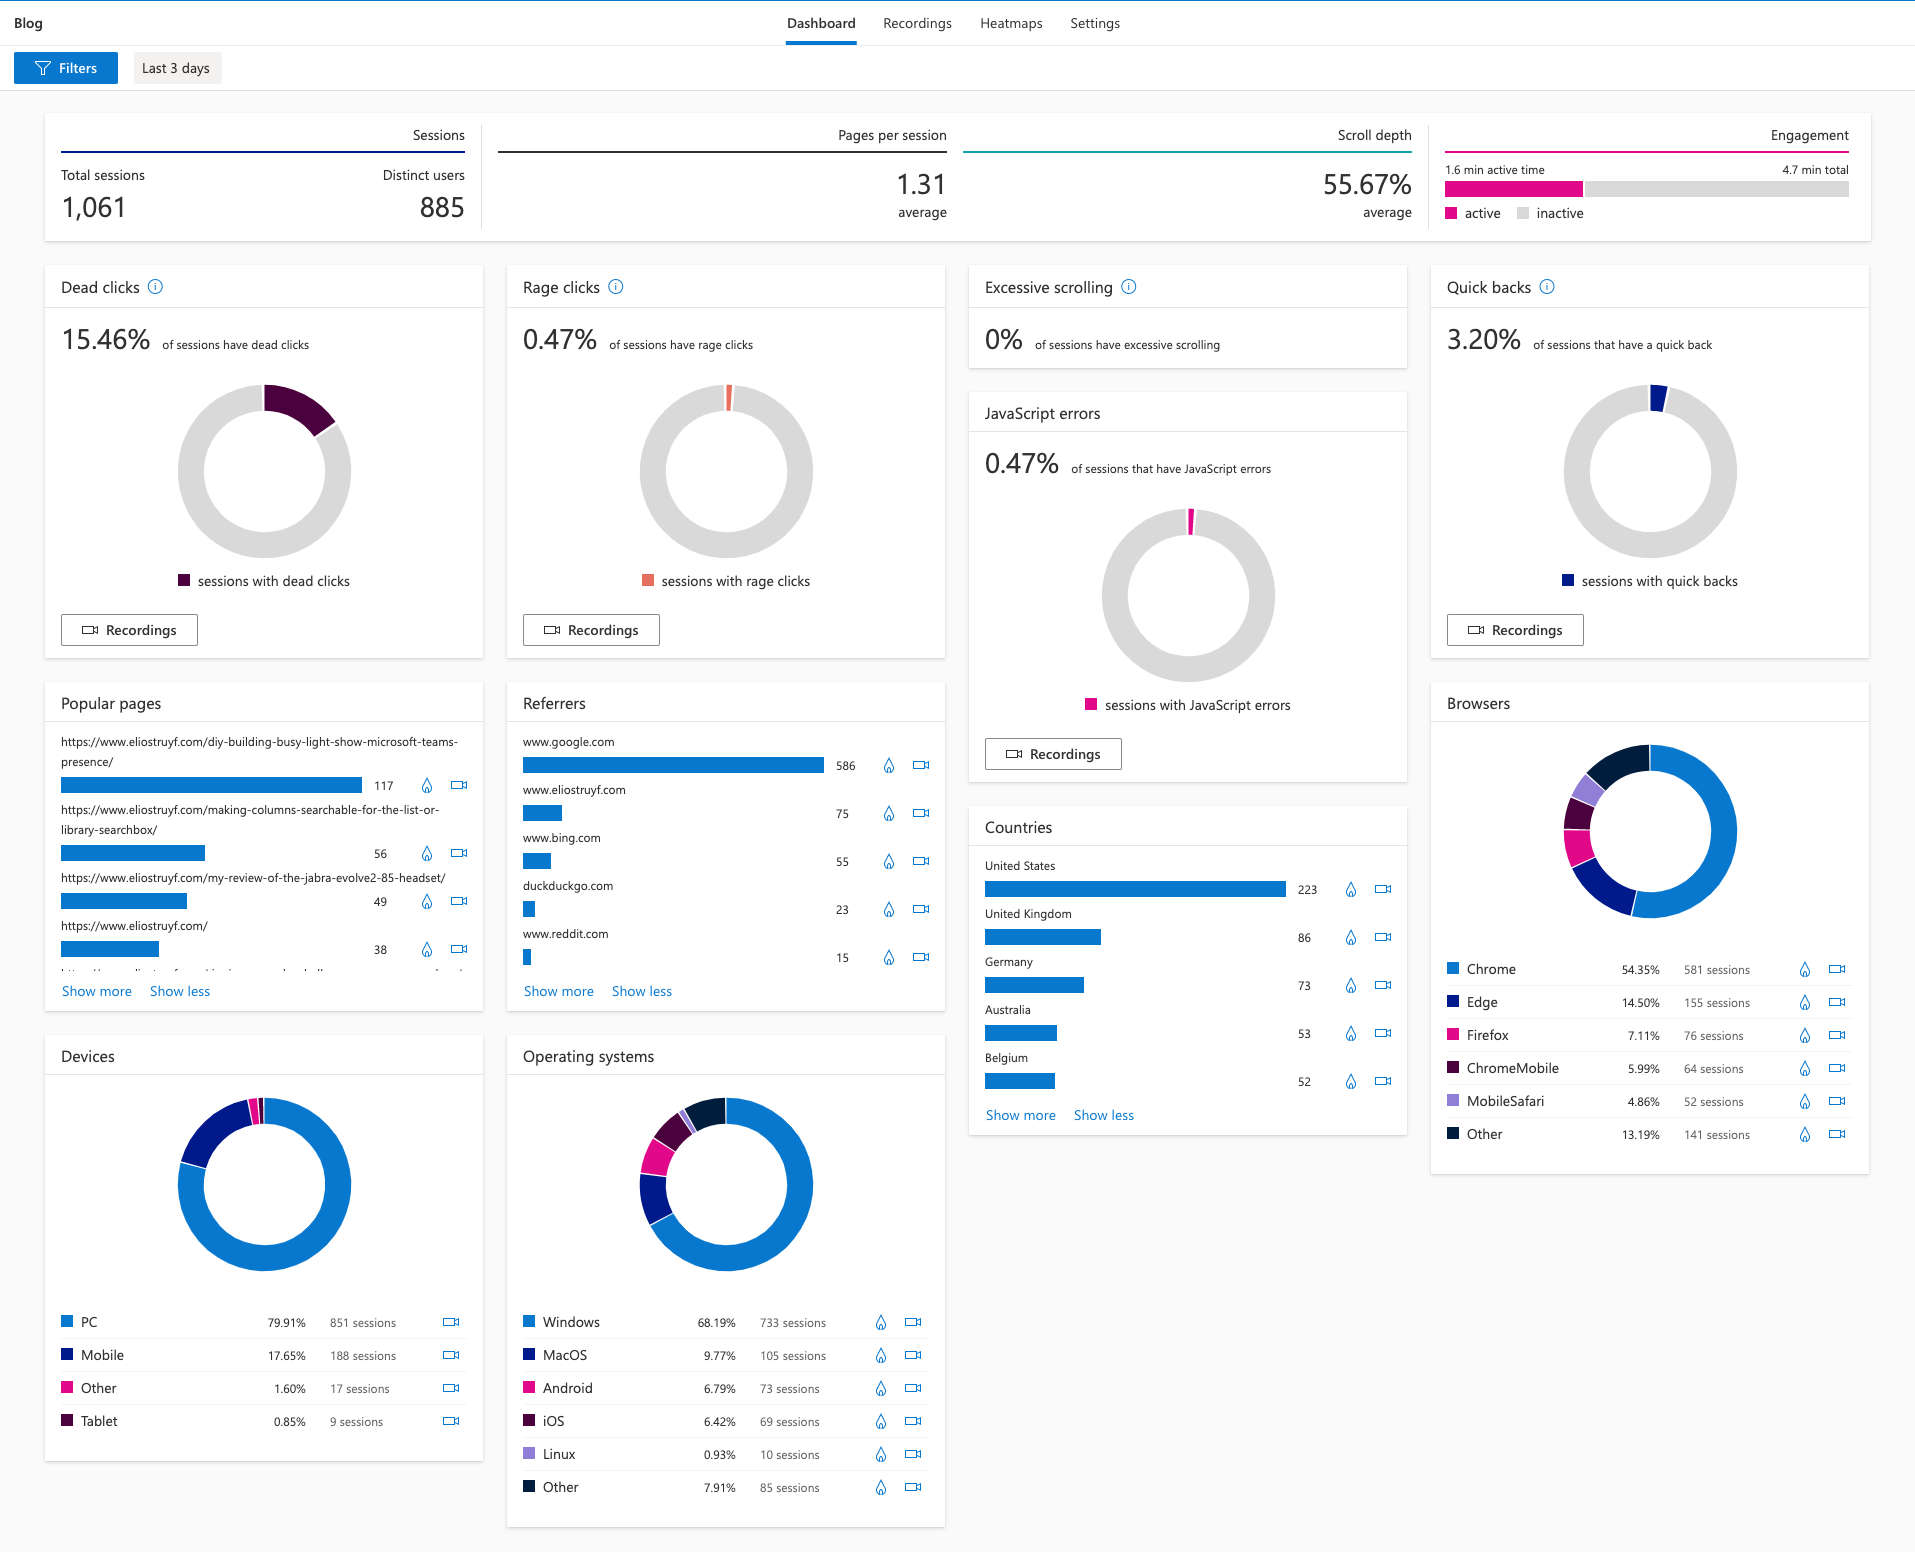
This dashboard is also possible with Google Analytics, but I must say that this UI is so much easier and faster to navigate.
Recordings and Heatmaps
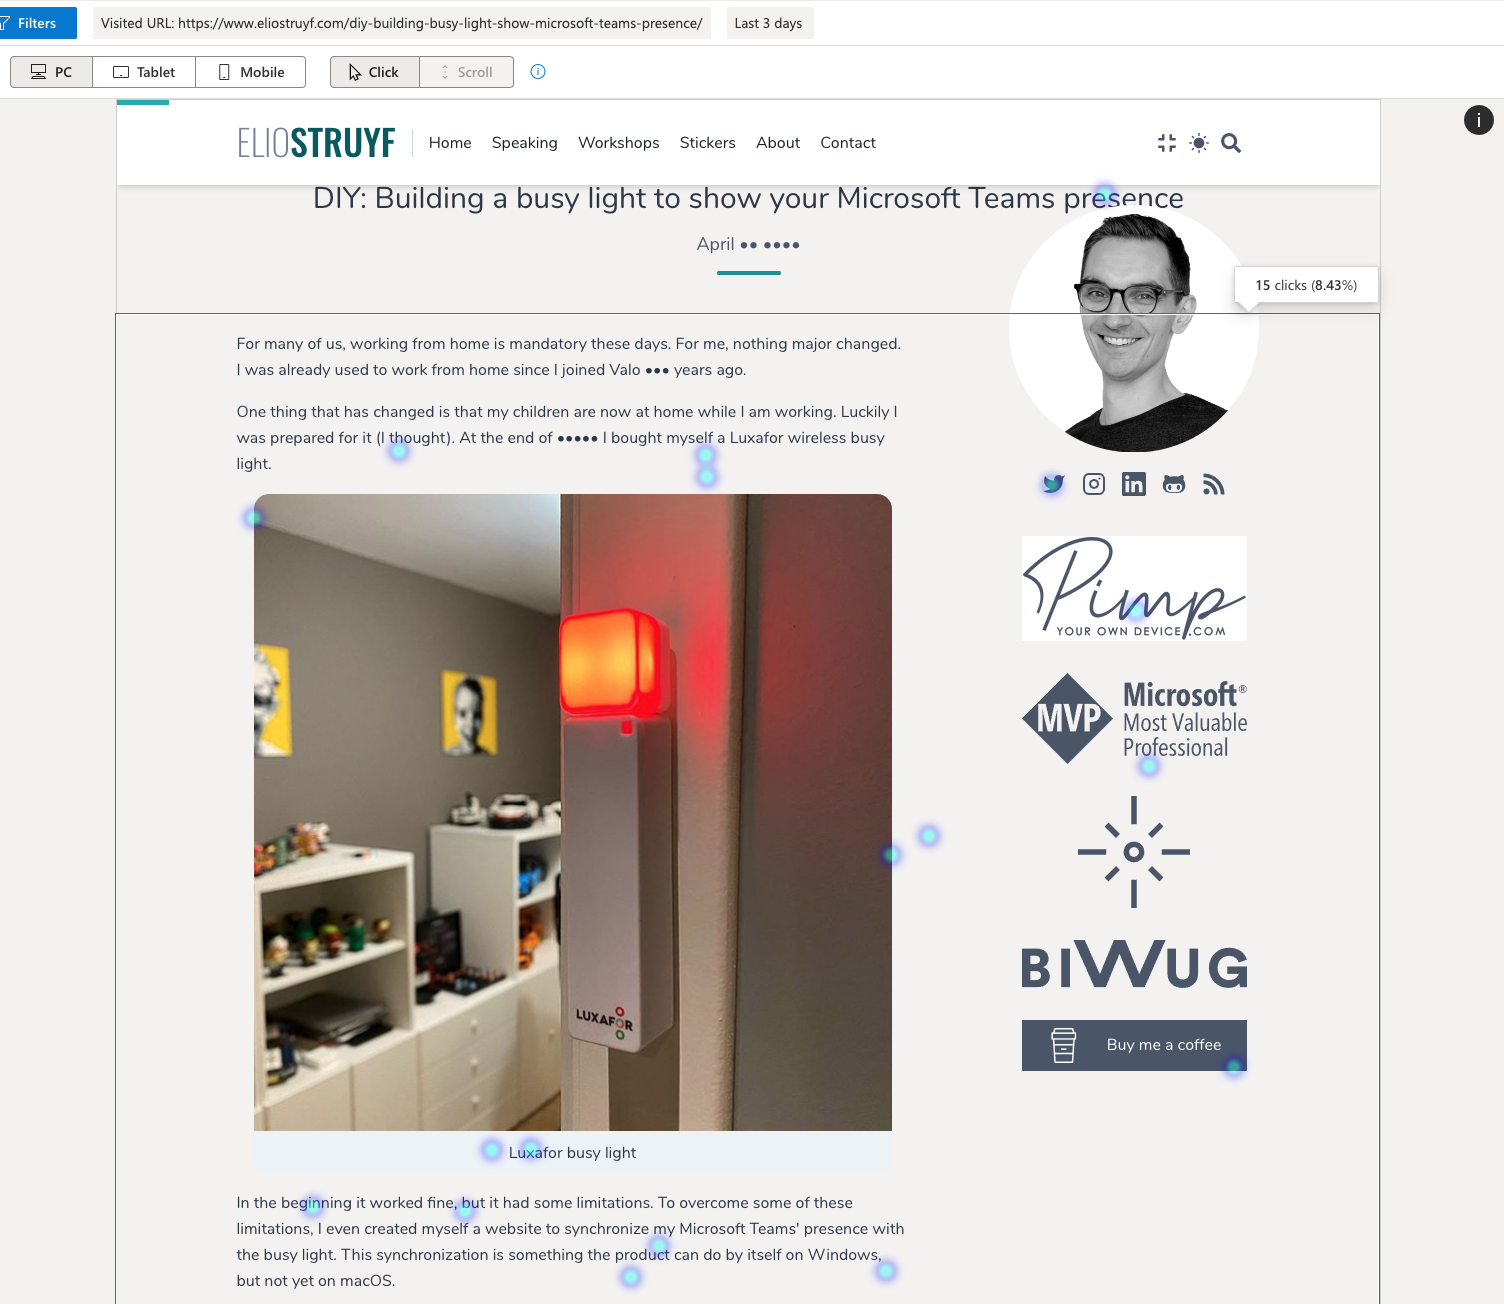
If you are interested to see how users are interacting with your pages, Clarity provides recordings and heatmaps.
Here is a sample of a recording:
The heatmap feature looks as follows:
Pricing
This service is free to use. You only require a Microsoft account to get started.
Overall
The service does exactly what its name suggests. It gives clarity over your usage analytics.
Related articles
Report issues or make changes on GitHub
Found a typo or issue in this article? Visit the GitHub repository to make changes or submit a bug report.
Comments

Let's build together
Manage content in VS Code
Present from VS Code