Debug your SharePoint Framework code running in Microsoft Edge with Visual Studio Code
This post is over a year old, some of this information may be out of date.
For a long time, you were not able to remotely debug your SharePoint Framework solutions running in Microsoft Edge with Visual Studio Code. This was due to limitations of the Debugger for Edge and the Microsoft Edge developer tools.
The only possibility if you wanted to debug in Visual Studio Code, was to use Chrome in combination with the Debugger for Chrome Visual Studio Code extension. Which became one of the preferred extensions since SPFx version 1.3.4 for SPFx solutions.
Note: Check the SharePoint documentation for more information - Debug SharePoint Framework solutions in Visual Studio Code
Microsoft Edge DevTools Protocol
Since Windows 10 April 2018 Update, version 0.1 of the Microsoft Edge DevTools Protocol got released. In combination with the latest version of the Debugger for Edge extension, overriding the source map paths like with Chrome is now supported for Edge.
Note 1: here is the article about the Microsoft Edge DevTools Protocol release - https://blogs.windows.com/msedgedev/2018/05/11/introducing-edge-devtools-protocol/amp/
Note 2: more information about the Microsoft Edge DevTools Protocol itself can be found here - https://docs.microsoft.com/en-us/microsoft-edge/devtools-protocol/
Once you installed the latest Debugger for Edge extension, all you must do is duplicate the existing Chrome config you have in your “.vscode/launch.json” file, change the type property from “chrome” to “edge” and remove the runtimeArgs property.
The complete configuration for edge looks as follows:
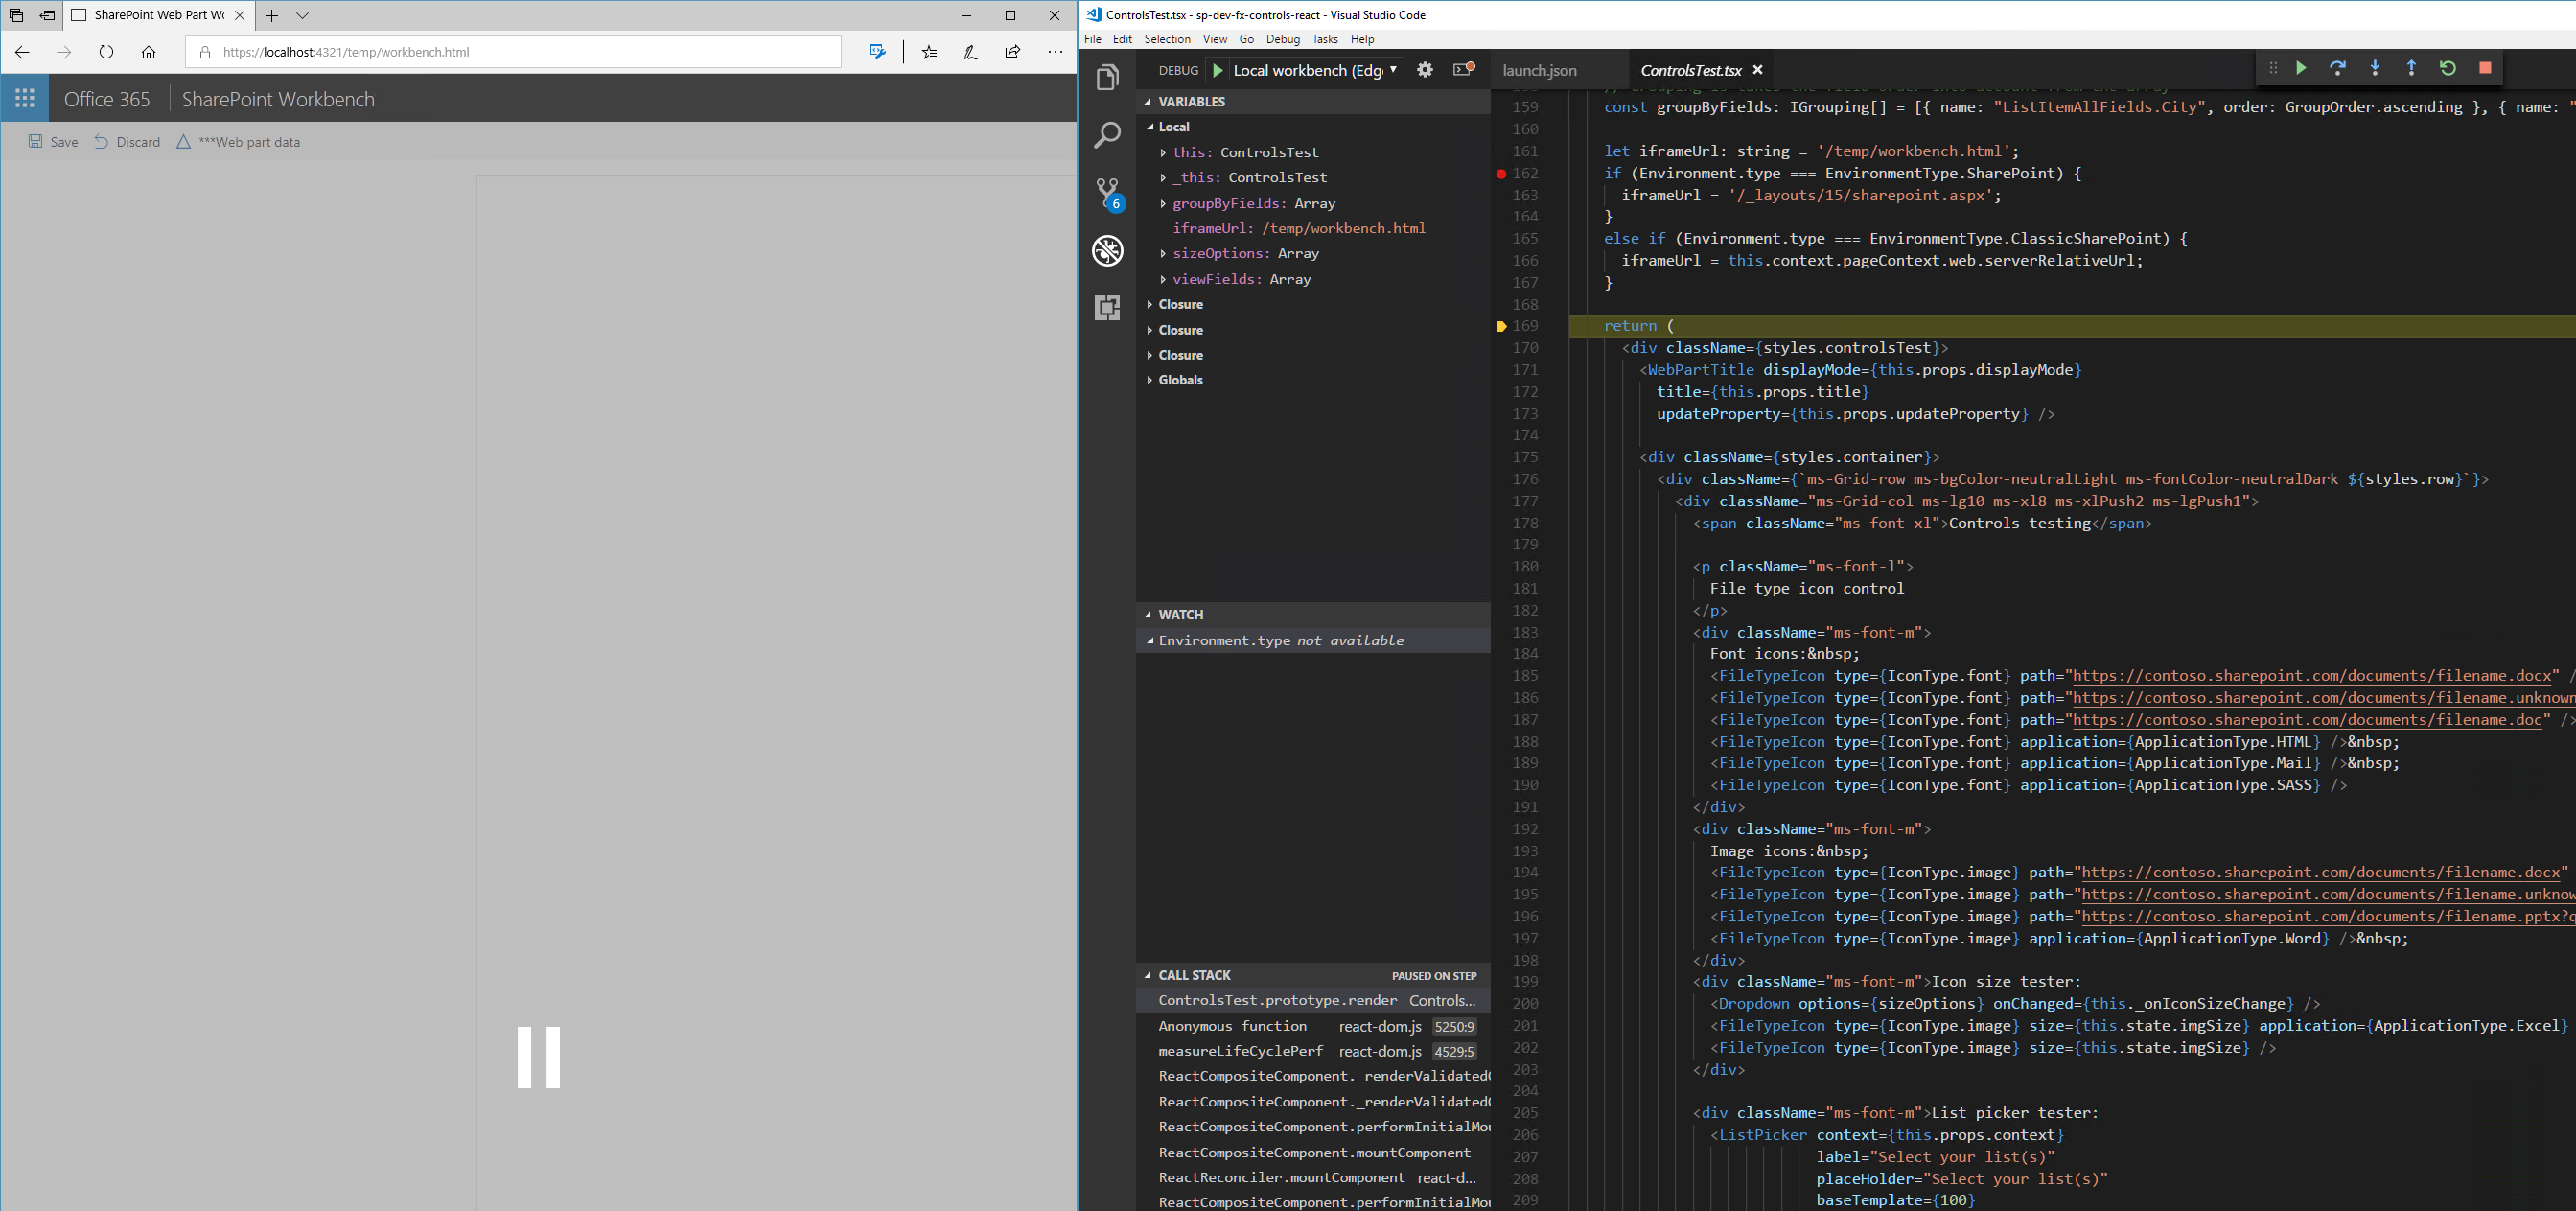
When you now press F5 (when the localhost service is running), you should be able to debug your solution in Visual Studio Code like with Chrome.
Happy coding!
Related articles
How to debug your SharePoint Framework unit-tests
Testing and debugging your SPFx solutions in production without causing any impact
SharePoint Framework bookmarklet tool for quick and easy debugging
Report issues or make changes on GitHub
Found a typo or issue in this article? Visit the GitHub repository to make changes or submit a bug report.
Comments

Let's build together
Manage content in VS Code
Present from VS Code
Engage with your audience throughout the event lifecycle