Already a great number of blog posts have been written about the new SharePoint Framework release two days ago. With every new tool or framework, there is a learning curve. The best way of learning how the SharePoint Framework works is by reading the code and debugging it.
This article focusses on how you can quickly debug your web part created with the SharePoint Framework.
Important: this article is written for Chrome. The experience in other browsers can vary a bit.
Using debugger statement
The SharePoint Framework makes use of a tool called webpack. Webpack is just great, you can do many things with it, but the overall use is for generating a bundled JS file. When you are going to run gulp serve it will bundle all the files into a single JavaScript file. This single JavaScript file contains a lot of content.
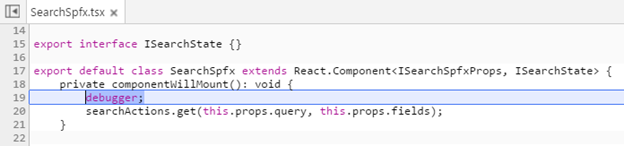
If you want to set a breakpoint to debug your code, it takes some time before you found the right line. An easier way is by setting a debugger statement in your source file.
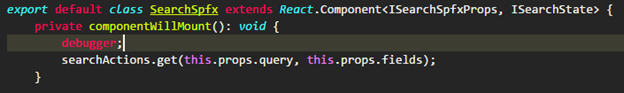
Save this change and open your browser developer tools (or refresh the page with the dev tools open). Once the page gets reloaded, your developer tools will stop on the debugger statement.
Debugging the TypeScript files
As mentioned, the SharePoint Framework bundles everything in one large JavaScript file.
Debugging this large JS file is a hell of a job and it is JavaScript. Your source files are written in TypeScript, so the code you are going to debug is not the same.
Luckily there is something called source maps. Source maps is not something new, these were used a couple of years ago to easily debug minified code (JavaScript and also CSS) where it was used to provide you a mapping from the minified code to the original code.
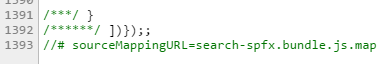
When you are writing TypeScript and transpiling the code to JavaScript. You have the option to include a source map reference at the bottom of the file. The SharePoint Framework will automatically do this, so you do not have to worry about it.
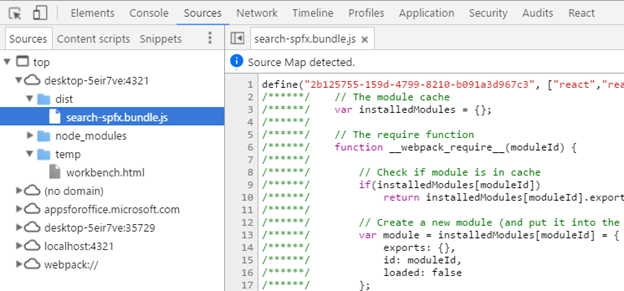
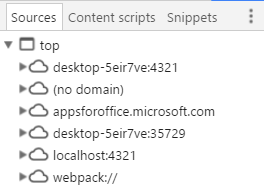
The great thing about these source maps is that your browser can read them and load the original code. If you take a look in the sources, you will see a webpack:// reference:
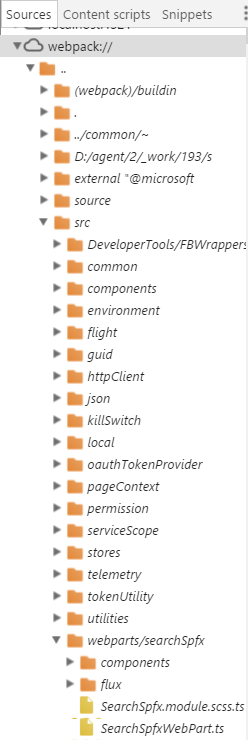
If you open this, you will see that all the original files are loaded and you can navigate to your original web part TypeScript files:
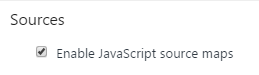
Important: check that you have enabled JavaScript source maps in your browser settings.
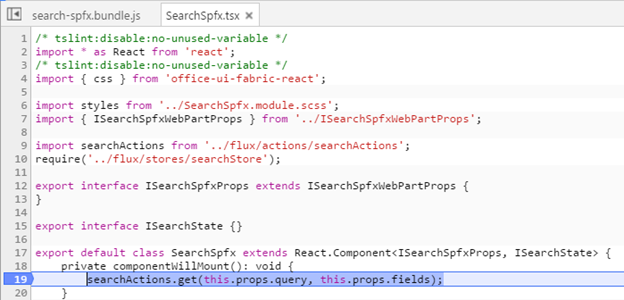
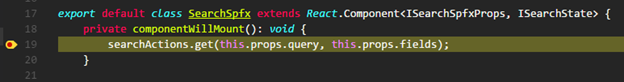
Once you found the file you were looking for, you can set a breakpoint in it and start debugging:
Info: Andrew Connell wrote a great article about debugging and sourcemaps last week: Debugging Node.js projects with TypeScript and VS Code - Digging into Sourcemaps
Debugging in Visual Studio Code
You can also use Visual Studio Code to debug your web part. To do this, you will have to install an extension called VS Code - Debugger for Chrome. The extension can be found here: Chrome debugger extension.
Info: there are other ways of debugging in Visual Studio Code, but this requires the least configuration.
Once you have installed it, you have to do the following configuration: extension configuration.
- Create a launch.json file in the .vscode folder;
- Add the following configuration code to it:
Before drop 6
| |
Drop 6
| |
As of Drop RC0 and onwards
| |
- Press F5 to start a new debugging session;
- Another way to open Chrome with the debugging port is via the command prompt and specifying the remote debugging port argument:
--remote-debugging-port=9222
| |
Important: it might occur that the Visual Studio Code debugger mentions that it cannot attach. Best is to close all the Chrome sessions (check in your task manager) and start Chrome again with the remote debugging port.
- Once you started Chrome, start gulp serve (you can keep this running in the back);
- Now you can press F5 in Visual Studio Code and you are ready to debug your code;
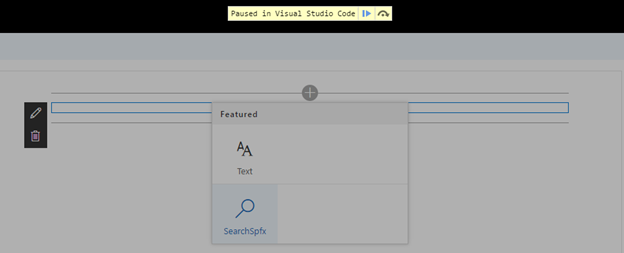
- Place a breakpoint somewhere in your web part and add it to the workbench. You will see that Chrome will pause and tells you that you can debug it in Visual Studio Code.
Happy coding with the SharePoint Framework.
Update
Microsoft released its own article of how you could debug your SharePoint Framework projects, you can find the article here: Debug SharePoint Framework solutions in Visual Studio Code.