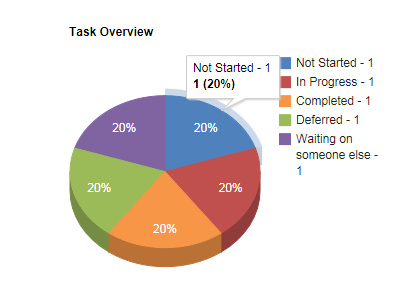
In this post I will explain how you could create a Google Pie Chart with the use of XSLT. The data that I am going to visualize are the tasks statuses, so that you get an overview of all the tasks.
The pie chart that will be used is the following: Pie Chart.
What do you need?
You only need to have SharePoint 2010 Designer and a standard task list with a couple of items in it.
Actions
Step 1.
Open your site in SharePoint 2010 Designer.
Step 2.
Open the page were you want to put your chart in edit mode.
Step 3.
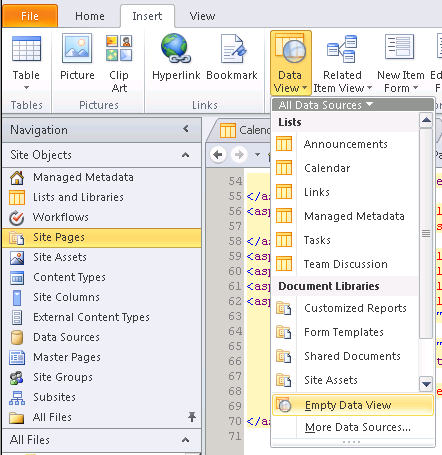
Insert an Empty Data View by selecting the Insert Tab and click on Data View -> Empty Data View.
Step 4.
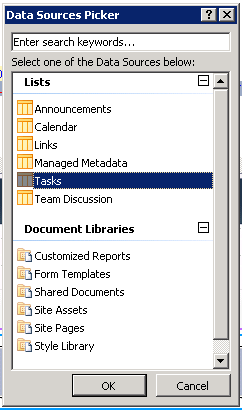
Click on the Click here to select a data source link and select the task list you want to use.
Step 5.
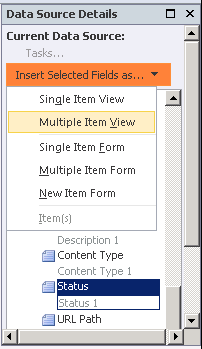
Now that you have selected the list, the data source connection can be made by selecting some fields (Title and Status) and adding them as Multiple Item View to the data view.
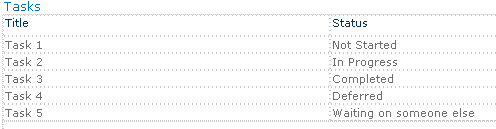
The result of your added fields should look something like this (based on which items are in your list).
Step 6.
Now we are going to start by building the chart in XSLT.
Replace the content of the XSLT template with match="/" with the following content:
1
2
3
4
5
6
7
8
| <!-- Google Chart JavaScript Reference -->
<script type="text/javascript" src="https://www.google.com/jsapi"></script>
<!-- Call the dvt_1 template -->
<xsl:call-template name="dvt_1"/>
<!-- Create the chart div -->
<div id="chart_div"></div>
|
Step 7.
Replace the content of the XSLT template with name=“dvt_1” with the following content:
 1
 2
 3
 4
 5
 6
 7
 8
 9
10
11
12
13
14
15
16
17
18
19
20
21
22
23
24
25
26
27
28
29
30
31
32
33
34
35
| <xsl:variable name="Rows" select="/dsQueryResponse/Rows/Row"/>
<xsl:variable name="RowCount" select="count($Rows)"/>
<!-- CDATA - (Unparsed) Character Data -->
<!-- The text inside CDATA will not be parsed by the XML parser. -->
<!-- Check http://code.google.com/apis/chart/interactive/docs/quick_start.html for more information -->
<xsl:text disable-output-escaping="yes"><![CDATA[
<script type="text/javascript">
google.load('visualization', '1.0', {'packages':['corechart']});
google.setOnLoadCallback(drawChart);
function drawChart() {
var data = new google.visualization.DataTable();
data.addColumn('string', 'Tasks');
data.addColumn('number', 'Status');
data.addRows([
]]></xsl:text>
<!-- Call the body template -->
<xsl:call-template name="dvt_1.body">
<xsl:with-param name="Rows" select="$Rows"/>
<xsl:with-param name="FirstRow" select="1" />
<xsl:with-param name="LastRow" select="$RowCount" />
</xsl:call-template>
<!-- Closing the JavaScript content -->
<xsl:text disable-output-escaping="yes"><![CDATA[
]);
var options = {'title':'Task Overview', 'width':500, 'height':400, is3D: true, colors:['#4F81BD','#C0504D','#F79646','#9BBB59','#8064A2']};
var chart = new google.visualization.PieChart(document.getElementById('chart_div'));
chart.draw(data, options);
}
</script>
]]></xsl:text>
|
Important in this code are the <![CDATA[ ]] sections. These enable you to add/create JavaScript code to the page. More information about the use of CDATA can be found here.
Step 8.
The code in the previous step creates a call to the dvt1.body template. The purpose is to generate the rows to be used in the chart.
The content of the dvt1.body template needs to be replaced by the following code:
 1
 2
 3
 4
 5
 6
 7
 8
 9
10
11
12
13
14
15
16
17
18
19
20
21
22
23
24
25
26
27
28
29
30
31
32
33
34
35
36
37
38
39
40
41
42
43
44
45
46
47
48
49
50
51
52
53
54
55
56
57
| <xsl:param name="Rows"/>
<xsl:param name="FirstRow" />
<xsl:param name="LastRow" />
<xsl:variable name="dvt_Rows">
<root>
<xsl:for-each select="$Rows">
<xsl:if test="(position() >= $FirstRow and position() <= $LastRow)"><xsl:copy-of select="." /></xsl:if>
</xsl:for-each>
</root>
</xsl:variable>
<xsl:for-each select="$Rows">
<!-- Sort items on the task status -->
<xsl:sort select="@Status" order="descending"/>
<!-- Retrieve the current status -->
<xsl:variable name="NewGroup">
<!-- Check if the name is changed since the last time this function was called. -->
<!-- It returns an empty string if the value has not changed; otherwise, the previous value is returned. -->
<xsl:value-of select="ddwrt:NameChanged(string(@Status), 0)" />
</xsl:variable>
<xsl:if test="not($NewGroup='') and position() >= $FirstRow and position() <= $LastRow or ($FirstRow = position())">
<!-- Retrieve the current group name -->
<xsl:variable name="GroupingName">
<xsl:choose>
<xsl:when test="$NewGroup=''"><xsl:value-of select="@Status" /></xsl:when>
<xsl:otherwise><xsl:value-of select="$NewGroup" /></xsl:otherwise>
</xsl:choose>
</xsl:variable>
<!-- Do not call the GoogleDataRow template on the first run, otherwise you will have an empty datarow. -->
<xsl:if test="not((position()=1) or (position()=$FirstRow))">
<xsl:call-template name="GoogleDataRow">
<xsl:with-param name="fieldvalue" select="$GroupingName" />
<!-- Count rows that share the same Status value -->
<xsl:with-param name="total" select="count($Rows[@Status = $GroupingName])"/>
<xsl:with-param name="last"></xsl:with-param>
</xsl:call-template>
</xsl:if>
</xsl:if>
<!-- Check if the current row is the last row to be processed. -->
<xsl:if test="position() = count($Rows)">
<xsl:variable name="GroupingName">
<xsl:value-of select="@Status" />
</xsl:variable>
<xsl:call-template name="GoogleDataRow">
<xsl:with-param name="fieldvalue" select="$GroupingName" />
<!-- Count rows that share the same Status value -->
<xsl:with-param name="total" select="count($Rows[@Status = current()/@Status])"/>
<!-- Let the function know that it is the last row -->
<xsl:with-param name="last">true</xsl:with-param>
</xsl:call-template>
</xsl:if>
</xsl:for-each>
|
Step 9.
All other default templates may be removed because they will not be used. Normally this should be the following templates:
- name=“dvt_1.rowview”
- name=“dvt_1.empty”
- name=“dvt_1.commandfooter”
- name=“dvt_1.navigation”
Step 10.
The last thing that needs to be added is the GoogleDateRow template.
 1
 2
 3
 4
 5
 6
 7
 8
 9
10
11
12
13
14
15
16
| <!-- GoogleDataRow template -->
<xsl:template name="GoogleDataRow">
<xsl:param name="fieldvalue" />
<xsl:param name="total" />
<xsl:param name="last" />
<!-- The Google JavaScript Chart expects the data to be written in the following format: ['String', number] -->
<xsl:choose>
<xsl:when test="$last='true'">
['<xsl:value-of select="$fieldvalue"/> - <xsl:value-of select="$total" />', <xsl:value-of select="$total" />]
</xsl:when>
<xsl:otherwise>
['<xsl:value-of select="$fieldvalue"/> - <xsl:value-of select="$total" />', <xsl:value-of select="$total" />],
</xsl:otherwise>
</xsl:choose>
</xsl:template>
|
This template adds the data row to the generated JavaScript code.
Step 11.
Someone mentioned that only the first ten items are retrieved. This can be change by doing a search for Name=“MaximumRows”, this will give you the following parameter:
1
| <asp:Parameter DefaultValue="10" Name="MaximumRows"></asp:Parameter>
|
Remove this parameter and you will retrieve all the items.
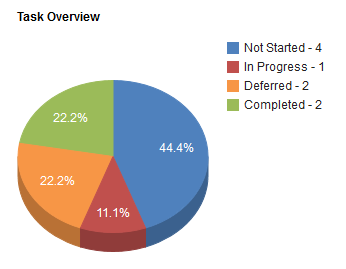
Result
Download
XSLT Data View Web Part